
Should you use a semantic layer so every dashboard shows the same metric definitions?
A semantic layer can reduce argument about KPIs by centralising metric definitions in one governed place and reusing them across tools. It is useful when dashboards drift apart, but it does not fix weak source data or remove the need for ownership and review.

On this page
ProblemHow it worksWhen it helpsTrade-offsSafeguardsNext stepsIn short
- A semantic layer gives one governed definition for a metric, so different tools can calculate it the same way.
- It is most useful when the same KPI appears in multiple dashboards or teams keep redefining the numbers.
- It can reduce duplicate logic, but it will not repair bad source data or unclear business rules.
- The best use case is a lightweight central layer before overbuilding a bigger data platform.
- You still need ownership, permissions and a review process for changes.
If one team says “conversion” and another means something slightly different, the dashboard is already steering decisions off course. A semantic layer can help by giving your business one agreed definition for each metric, then reusing that definition across dashboards, notebooks and BI tools. That makes it a useful step before you invest in a larger data platform. It is not, however, a magic fix for messy source data or weak governance.
Why dashboards drift apart
The same business question often gets answered in several places. A finance dashboard, a product dashboard and an operations dashboard may all show “revenue”, “active users” or “conversion”, but not always in the same way. One team may count refunds differently. Another may exclude internal users. A third may calculate a rolling 30-day figure while everyone else uses calendar months. The result is not just inconsistent reporting. It is inconsistent decisions.
This is where a semantic layer becomes useful. Instead of letting every dashboard build its own metric logic, you define the metric once in a shared layer and reuse it downstream. dbt describes its Semantic Layer as a way to centralise business metric definitions in the modelling layer and reduce duplicate code and inconsistency. Microsoft Learn describes Databricks metric views in the same broad way: a semantic layer that turns tables and views into standardised business metrics for reuse across dashboards, notebooks and external BI tools.
What a semantic layer actually does
A semantic layer sits between raw data models and the tools people use to explore or report on them. It is a governed place to define metrics, dimensions and business logic once, then expose those definitions consistently. In dbt, that definition is code-based: the Semantic Layer is described through a YAML specification for semantic models, metrics and dimensions. That matters because it moves metric logic out of ad hoc dashboard formulas and into version-controlled modelling.
In practice, this can mean one agreed definition for monthly recurring revenue, qualified leads, active customers or on-time delivery. BI tools and notebooks then query the same definition rather than each re-implementing it. Databricks’ guidance also supports this idea, recommending local metric views for reusable semantic logic rather than repeating custom calculations on a SQL dataset.
What it centralises
Metric names, formulas, dimensions, filters and business rules that should not be rewritten in every dashboard.
What it does not centralise
Bad source data, unclear ownership, inconsistent upstream processes or business rules no one has agreed on.
Illustrative example: if “conversion rate” is defined as completed purchases divided by unique visitors in the same period, that rule lives once in the semantic layer. A sales dashboard, a weekly leadership pack and a notebook used by analysts all reuse the same calculation. If the business later decides to exclude test traffic, that change is made once and then propagated.
When a semantic layer is a good fit
- The same KPI appears in several dashboards and people keep asking why the numbers differ.
- Analysts spend time copying and updating the same metric logic in multiple places.
- Leaders need one version of a number for review meetings and operational tracking.
- You want more governance without jumping straight to a large, complex data platform.
- You need a lightweight way to standardise metrics before more teams depend on them.
This is why the semantic layer is often a sensible middle step. It improves consistency without forcing you to redesign everything at once. For a smaller team, that can be the difference between tidy governance and an ambitious platform project that never settles. If the business is still learning which metrics matter, a lightweight semantic layer is usually easier to adjust than a fully built enterprise warehouse model.
Where the abstraction can get in the way
A semantic layer adds value, but it also adds structure. That structure can become restrictive if you expect it to solve every analysis problem. Databricks notes that metric views can be queried across several surfaces, but also highlights limitations such as missing data profiling support and some collaboration constraints. It also states that metric views are the semantic definition and cannot be joined with other tables or with another metric view in that mode, which matters when analysts need more flexible modelling.
dbt’s own administration guidance also shows that product details matter. Its setup docs note environment-specific constraints and access differences, including that development querying is still coming soon and that production credentials do not support SSO in the same way as development user accounts. In other words, the right design choice depends on the tool, the deployment environment and the way your team works.
Lightweight semantic layer
Best when you need a shared definition of a handful of important metrics, with controlled change and less duplication.
Heavier data platform first
Best when your immediate problem is broader modelling, integration complexity, scale, governance layers or many conflicting data sources.
The danger is overusing the semantic layer as a substitute for data modelling discipline. If source tables are messy, if business rules are unclear, or if teams need radically different calculations, the semantic layer will not remove the hard work. It will only make the hard work more visible.
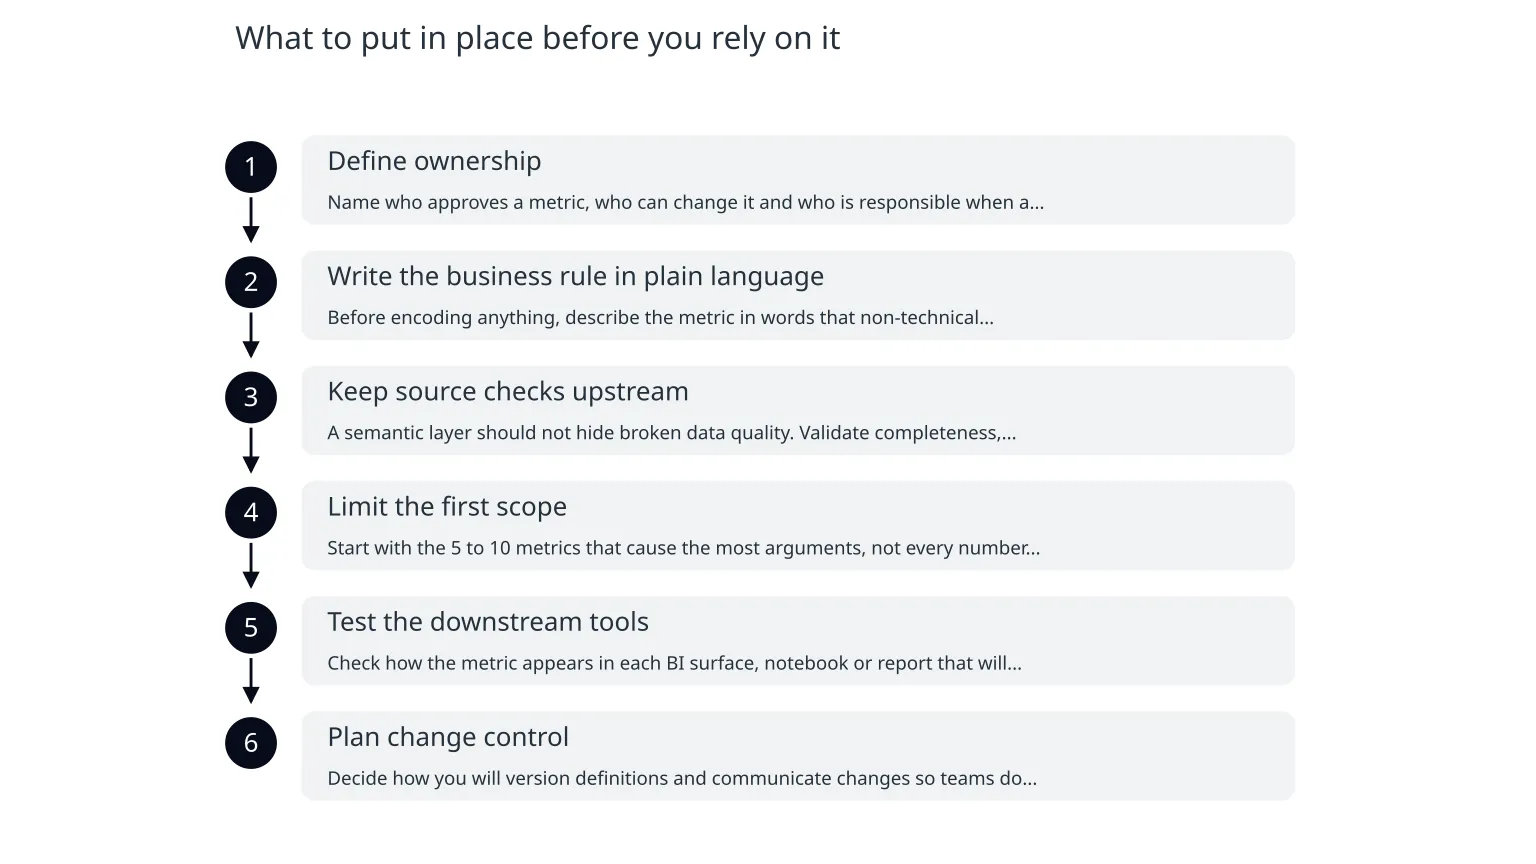
What to put in place before you rely on it
- 1
Define ownership
Name who approves a metric, who can change it and who is responsible when a dashboard changes.
- 2
Write the business rule in plain language
Before encoding anything, describe the metric in words that non-technical stakeholders can read and sign off.
- 3
Keep source checks upstream
A semantic layer should not hide broken data quality. Validate completeness, duplication and freshness before the metric is trusted.
- 4
Limit the first scope
Start with the 5 to 10 metrics that cause the most arguments, not every number in the business.
- 5
Test the downstream tools
Check how the metric appears in each BI surface, notebook or report that will use it.
- 6
Plan change control
Decide how you will version definitions and communicate changes so teams do not silently compare old and new logic.
Illustrative example: if your support team uses “resolved tickets” and your leadership dashboard uses “closed tickets”, that is not just a naming issue. It is a governance issue. A semantic layer can help standardise the definition, but only if the business has already agreed what the metric should mean. Otherwise you merely move confusion into a more formal place.
How to decide without overbuilding
If you are early in your data maturity, the question is not “Should we build an enterprise semantic layer?” It is “Do we have enough repeated metric pain to justify a lightweight shared definition layer now?” If the answer is yes, start with one or two core KPIs that leaders already use in decisions. Put the definitions in a governed place, expose them to the tools people actually use, and review whether the same metric now behaves consistently.
If you are still arguing about what a metric means, begin with a simple metric dictionary and ownership first. If you already know the definitions but people keep re-implementing them, a semantic layer is often the cleaner next step. If your data platform is still immature, it may be better to stabilise source systems and modelling before adding another abstraction.
0 of 6 complete
For teams that need support shaping the data model, deciding where the semantic layer belongs or connecting it to existing dashboards, specialist help can be useful. The value is not in adding another tool for its own sake. It is in reducing argument, duplication and drift before those problems harden into a larger platform design.

About the author
Nixim Team, Product Engineering
Practical guidance from Nixim on building software, working with AI and running dependable cloud systems.